Python-nvd3 is a Python wrapper for NVD3 graph library. NVD3 is an attempt to build re-usable charts and chart components for d3.js without taking away the power that d3.js gives you.
Project location : https://github.com/areski/python-nvd3
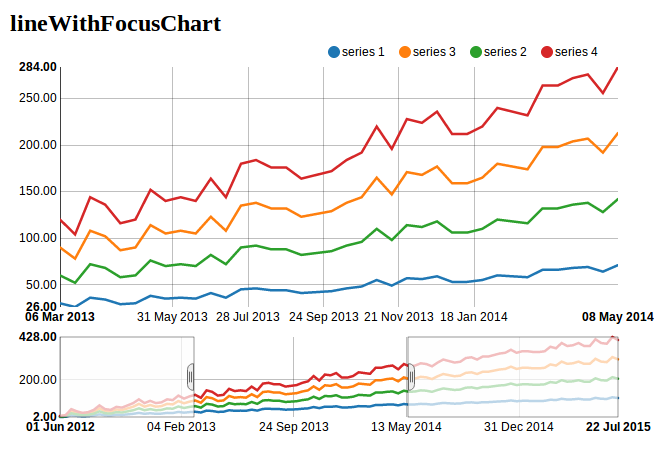
lineWithFocusChart
- class nvd3.lineWithFocusChart.lineWithFocusChart(**kwargs)
A lineWithFocusChart or line graph is a type of chart which displays information as a series of data points connected by straight line segments. The lineWithFocusChart provide a smaller chart that act as a selector, this is very useful if you want to zoom on a specific time period.
Python example:
from nvd3 import lineWithFocusChart
chart = lineWithFocusChart(name='lineWithFocusChart', x_is_date=True, x_axis_format="%d %b %Y")
xdata = [1365026400000000, 1365026500000000, 1365026600000000]
ydata = [-6, 5, -1]

extra_serie = {"tooltip": {"y_start": "", "y_end": " ext"},
               "date_format": "%d %b %Y"}
chart.add_serie(name="Serie 1", y=ydata, x=xdata, extra=extra_serie)
chart.buildhtml()
Javascript generated:
data_lineWithFocusChart = [{ "key" : "Serie 1",
   "values" : [
        { "x" : "1365026400000000",
          "y" : -6
        },
        { "x" : "1365026500000000",
          "y" : -5
        },
        { "x" : "1365026600000000",
          "y" : -1
        },
      ],
    "yAxis" : "1"
}]

nv.addGraph(function() {
        var chart = nv.models.lineWithFocusChart();
        chart.yAxis
            .tickFormat(d3.format(',.2f'));
        chart.y2Axis
            .tickFormat(d3.format(',.2f'));
        chart.xAxis
            .tickFormat(function(d) { return d3.time.format('%d %b %y')(new Date(d)) });
        chart.x2Axis
            .tickFormat(function(d) { return d3.time.format('%d %b %y')(new Date(d)) });
        chart.tooltipContent(function(key, y, e, graph) {
            var x = d3.time.format('%d %b %Y')(new Date(parseInt(graph.point.x)));
            var y = String(graph.point.y);
            if(key == 'serie 1'){
                var y = 'There is ' +  String(graph.point.y)  + ' calls';
            }
            tooltip_str = '<center><b>'+key+'</b></center>' + y + ' on ' + x;
            return tooltip_str;
        });
        d3.select('#lineWithFocusChart svg')
            .datum(data_lineWithFocusChart)
            .transition()
            .duration(500)
            .call(chart);
    return chart;
});