Python-nvd3 is a Python wrapper for NVD3 graph library. NVD3 is an attempt to build re-usable charts and chart components for d3.js without taking away the power that d3.js gives you.
Project location : https://github.com/areski/python-nvd3
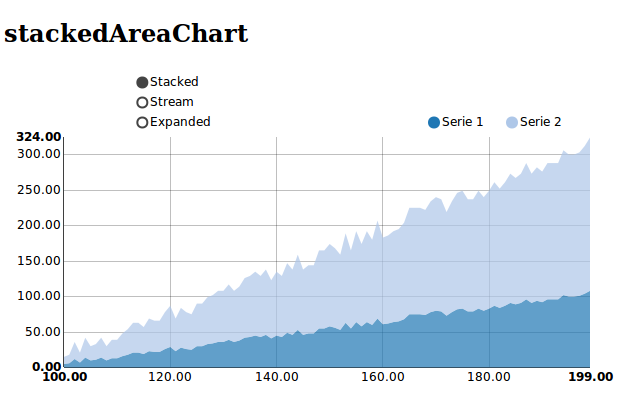
stackedAreaChart
- class nvd3.stackedAreaChart.stackedAreaChart(**kwargs)
The stacked area chart is identical to the area chart, except the areas are stacked on top of each other, rather than overlapping. This can make the chart much easier to read.
Python example:
from nvd3 import stackedAreaChart
chart = stackedAreaChart(name='stackedAreaChart', height=400, width=400)

xdata = [100, 101, 102, 103, 104, 105, 106,]
ydata = [6, 11, 12, 7, 11, 10, 11]
ydata2 = [8, 20, 16, 12, 20, 28, 28]

extra_serie = {"tooltip": {"y_start": "There is ", "y_end": " min"}}
chart.add_serie(name="Serie 1", y=ydata, x=xdata, extra=extra_serie)
chart.add_serie(name="Serie 2", y=ydata2, x=xdata, extra=extra_serie)
chart.buildhtml()
Javascript generated:
data_stackedAreaChart = [{
          "values":[
             {
                "y":9,
                "x":100
             },
             {
                "y":5,
                "x":101
             },
          ],
          "key":"Serie 1",
          "yAxis":"1"
       },
       {
          "values":[
             {
                "y":18,
                "x":100
             },
             {
                "y":10,
                "x":101
             },
          ],
          "key":"Serie 2",
          "yAxis":"1"
       }
    ]

nv.addGraph(function() {
    var chart = nv.models.stackedAreaChart();
    chart.xAxis
        .tickFormat(d3.format(',.2f'));
    chart.yAxis
        .tickFormat(d3.format(',.2f'));
    chart.tooltipContent(function(key, y, e, graph) {
        var x = String(graph.point.x);
        var y = String(graph.point.y);
        if(key == 'serie 1'){
            var y = 'There is ' +  String(graph.point.y)  + ' min';
        }
        if(key == 'serie 2'){
            var y = 'There is ' +  String(graph.point.y)  + ' min';
        }
        tooltip_str = '<center><b>'+key+'</b></center>' + y + ' at ' + x;
        return tooltip_str;
    });
    d3.select('#stackedAreaChart svg')
        .datum(data_stackedAreaChart)
        .transition()
        .duration(500)
        .call(chart);
    return chart;
});